Welcome to DU!
The truly grassroots left-of-center political community where regular people, not algorithms, drive the discussions and set the standards.
Join the community:
Create a free account
Support DU (and get rid of ads!):
Become a Star Member
Latest Breaking News
Editorials & Other Articles
General Discussion
The DU Lounge
All Forums
Issue Forums
Culture Forums
Alliance Forums
Region Forums
Support Forums
Help & Search
Science
Related: About this forumSome Graphics Taking Us Down Covid-"19" Memory Lane, Evolution, Current and Future.
The paper from which the following graphics are taken is this one: Three-Dimensional Visualization of Viral Structure, Entry, and Replication Underlying the Spread of SARS-CoV-2 James W. Saville, Alison M. Berezuk, Shanti S. Srivastava, and Sriram Subramaniam Chemical Reviews 2022 122 (17), 14066-14084.
I won't have time to go into the text, nor to produce more than a few of the graphics, but they remind us of what we went through, the work that went into addressing the problem, and some insight to the interesting virology, proteomics and genomics.
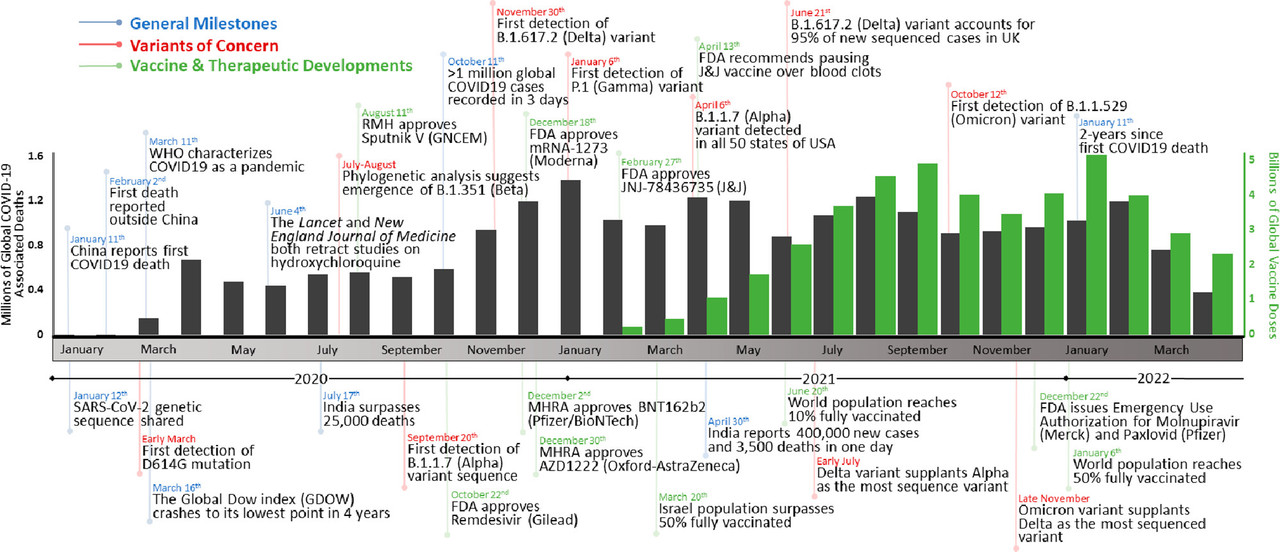
The caption:
Figure 1. Timeline of the COVID-19 pandemic. Events are divided into general milestones (blue), variants of concern (red), and vaccine and therapeutic developments (green). The number of global COVID-19-associated deaths (gray) and vaccine doses administered (green) are graphed per month over the course of the COVID-19 pandemic (ref (10)).
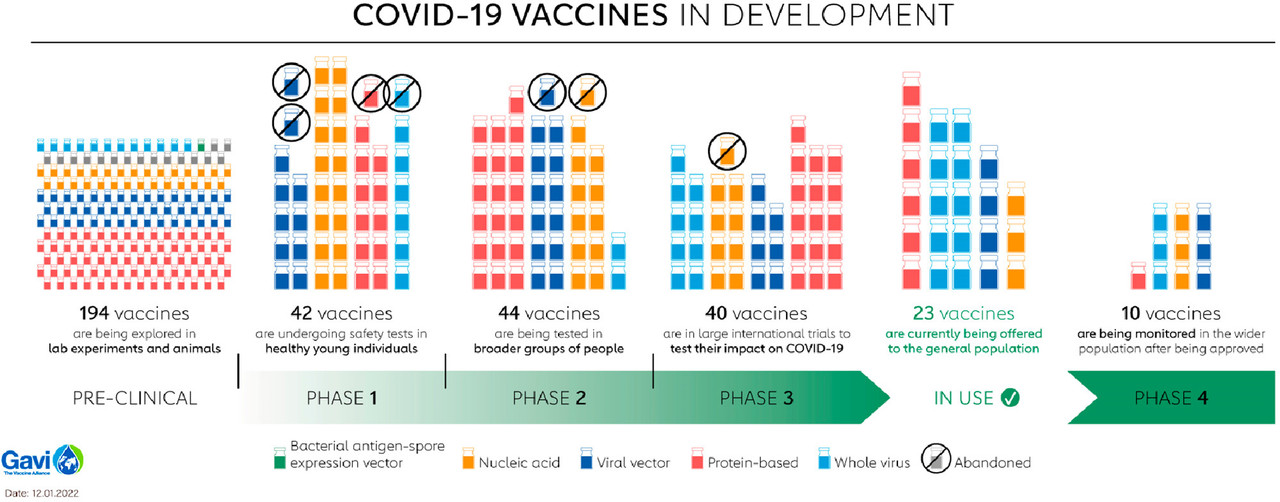
The caption:
Figure 2. Summary of SARS-CoV-2 vaccines in development. The 10 vaccines in phase 4 are the following: nucleic acids mRNA-1273 (Moderna), BNT162 (Pfizer/BioNTech), and mRNA-1273.351 (Moderna); viral vectors ChAdOx1 (AstraZeneca/Oxford), Ad5-nCoV (CanSino Biologics), and JNJ-78436735 (Johnson & Johnson); protein-based MVC-COV1901 (Medigen); whole virus CoronaVac (Sinovac), BBIBP-CorV (Beijing Institute of Biological Products), and BIBP (Sinopharm) (refs (17and20)). Adapted with permission from ref (20). Copyright 2022 Gavi, the Vaccine Alliance.
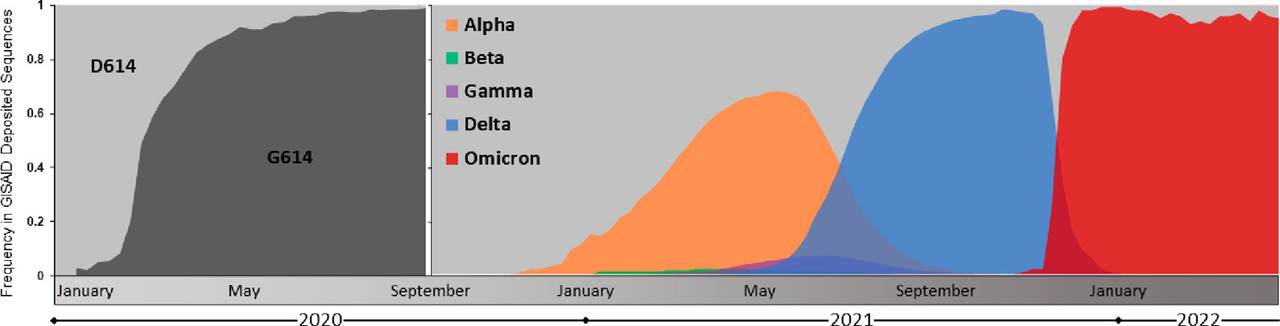
The caption:
Figure 3. Emergence and global prevalence of the D614G and variant of concern lineages of SARS-CoV-2. Sequence data was downloaded from the Global Initiative on Sharing All Influenza Data (GISAID) and graphed as weekly totals (refs (7and8)). D614 and G614 genotype prevalence is shown from January to September 2020, and variant of concern lineage prevalence is shown from September 2020 to April 2022.
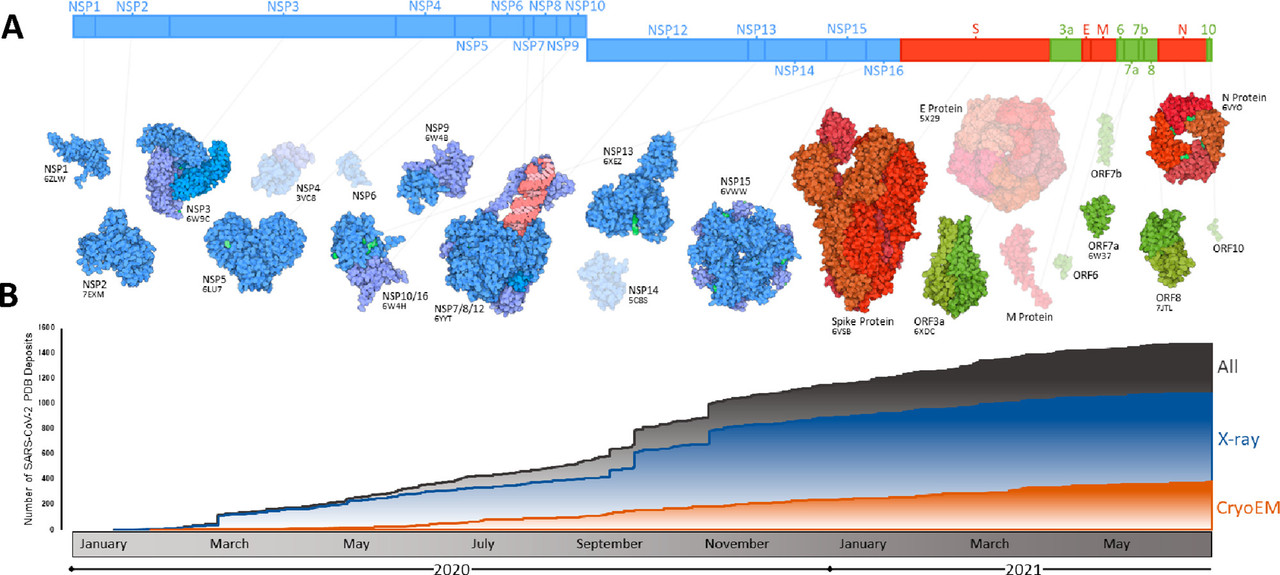
The caption:
Figure 4. Summary of progress toward SARS-CoV-2 structural characterization. (A) Schematic of the SARS-CoV-2 genome with structurally characterized proteins indicated in full color. Proteins that have not yet been characterized are displayed through homology modeling and are shown as semitransparent images (NSP4/6/12, E protein, M protein). Protein illustrations were generated using Illustrate (ref (34)). (B) The number of X-ray crystallography, cryo-EM, and all SARS-CoV-2 protein structures deposited into the RCSB protein data bank (PDB) over the first 18 months of the COVID-19 pandemic (ref (35)).
The caption:
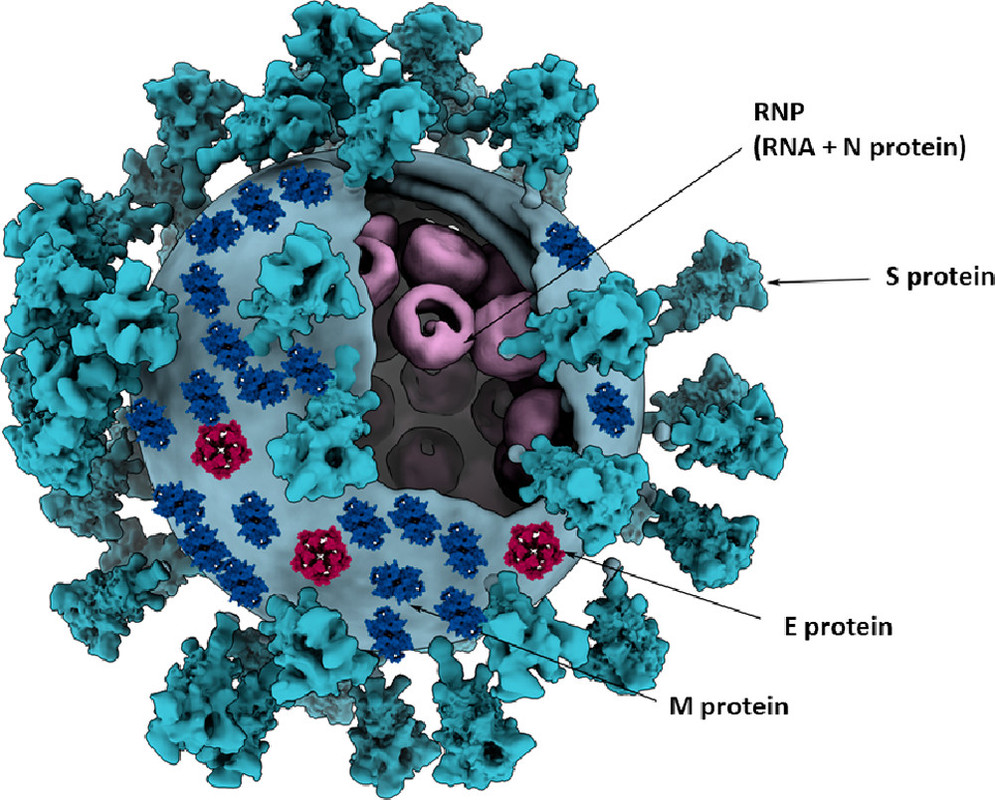
Figure 5. Three-dimensional model of a coronavirus particle. Membrane (M), spike (S), envelope (E), and nucleocapsid (N) structural proteins are shown. Models for E and M proteins were obtained from https://sars3d.com/ and were manually (not experimentally) arranged on the surface of a 3D model of the virion rendered using EMD-30430. Adapted with permission from ref (47). Copyright 2020 Elsevier.
The caption:
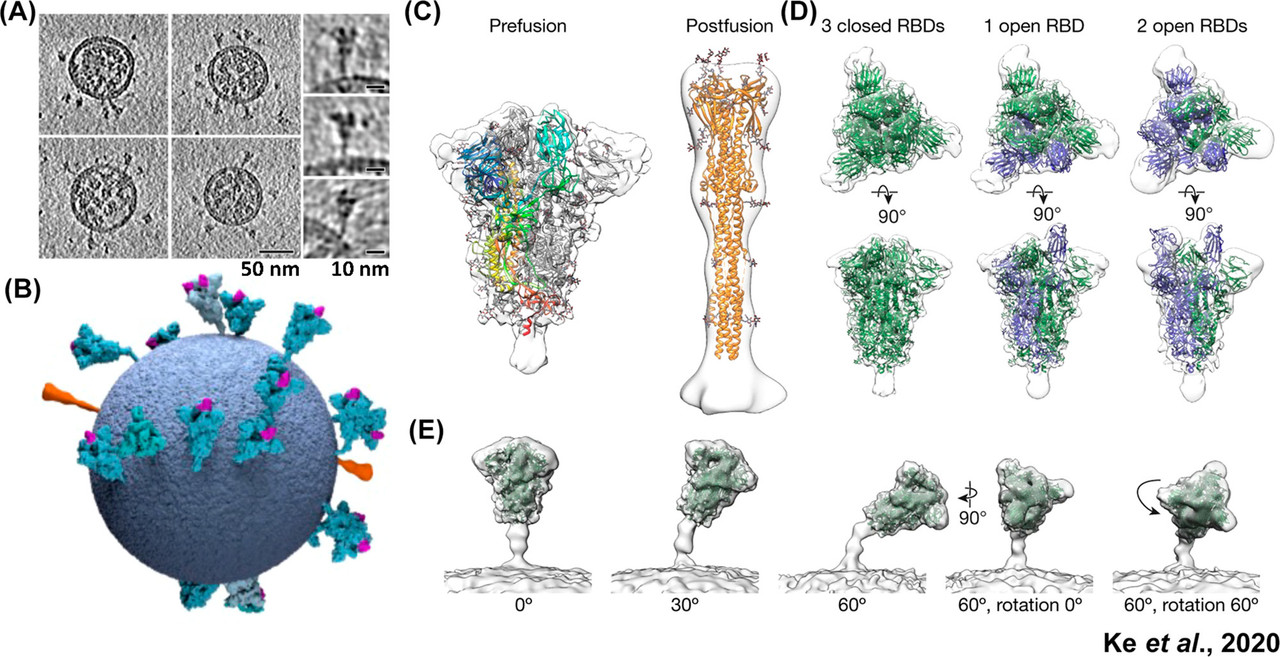
Figure 6. Spike protein distribution, conformations, and tilt angles in authentic SARS-CoV-2 virions. (A) Tomographic slices of four representative SARS-CoV-2 virions and side projections of three individual S proteins. (B) Three-dimensional model of a single SARS-CoV-2 virion derived from subtomogram averaging. Prefusion S proteins are colored in blue with up RBDs colored pink. Postfusion S protein densities are colored in orange. (C) Prefusion and postfusion S protein trimer densities obtained by subtomogram averaging and fitted with PDBs 6VXX and 6XRA, respectively. (D) Prefusion trimer conformations as observed on intact virions. The densities corresponding to three closed, one open, and two open RBDs are fitted with PDBs 6VXX, 6VYB, and 6X2B, respectively, with protomers containing up RBDs colored in blue. (E) Averaging of trimer subsets is shown for pools centered at 0°, 30°, and 60° from the normal, as well as for two rotations of the S protein relative to the tilt direction. Adapted with permission from ref (53).
The caption:
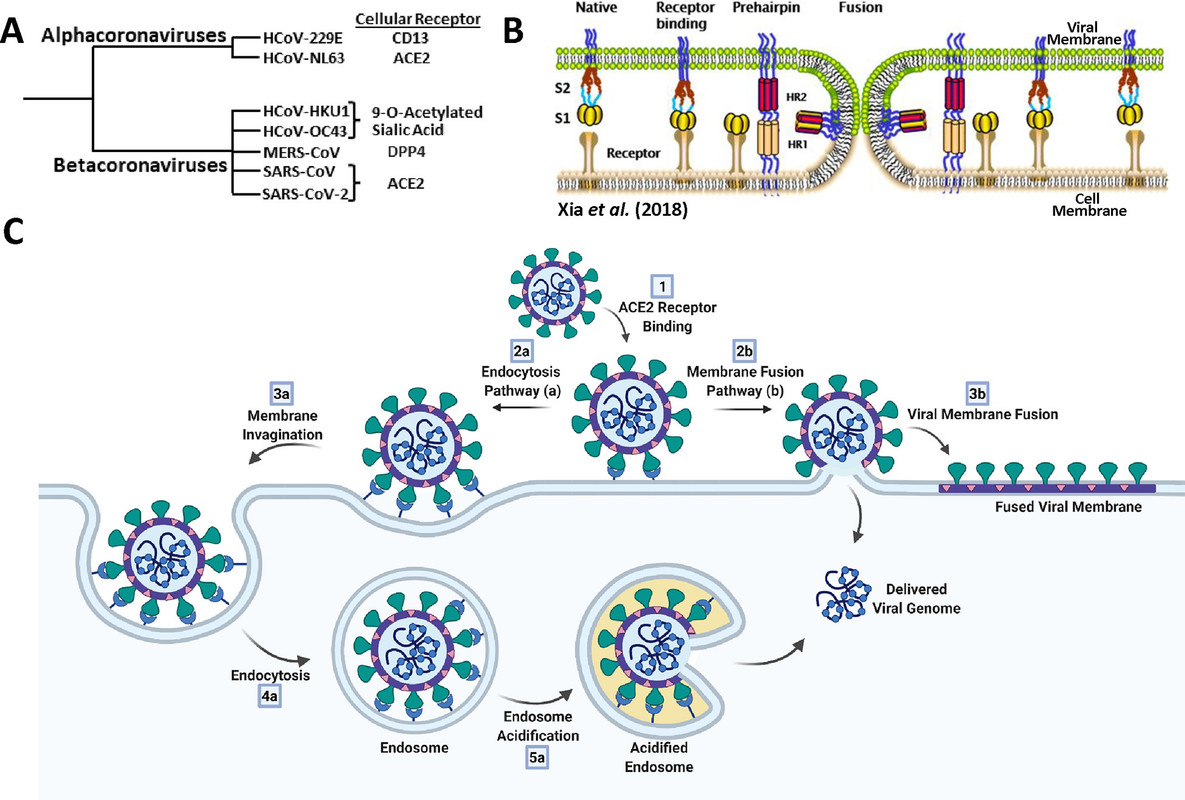
Figure 8. Overview of coronavirus cell-entry mechanisms. (A) Members of the α- and β-coronavirus genera and their major associated cellular receptors. (B) Model of coronavirus receptor-mediated membrane-fusion mechanism between viral and cellular membranes. Adapted from ref (72). Copyright 2018 Xia et al. http://creativecommons.org/licenses/by/4.0/. (C) Endocytosis (a) and membrane fusion (b) pathways of coronavirus cell entry. Created with BioRender.
The caption:
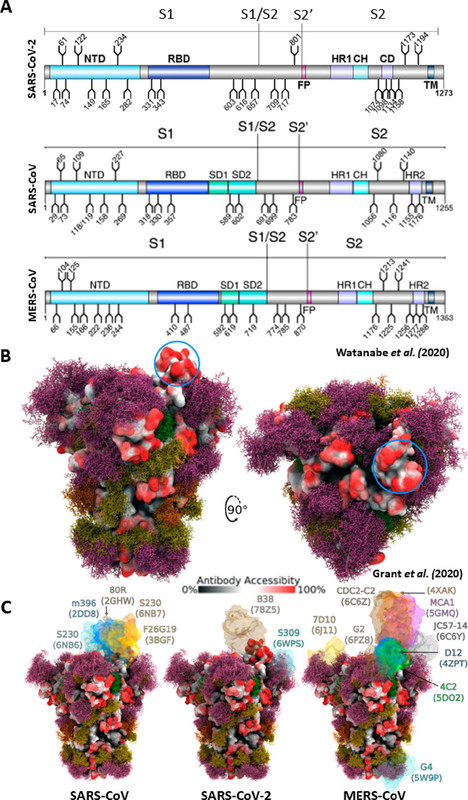
Figure 10. Glycosylation of the SARS-CoV-2, SARS-CoV, and MERS-CoV spike proteins. (A) Schematic representation of the SARS-CoV-2, SARS-CoV, and MERS-CoV protein open reading frames with glycosylation sites indicated (refs (94and95)). Adapted with permission from ref (95). Copyright 2020 Watanabe et al. http://creativecommons.org/licenses/by/4.0/. (B) Moss surface representation of SARS-CoV-2 S protein glycosylation from molecular dynamic simulations performed by Grant et al. (ref (101)). Glycans are shown in ball-and-stick representations and colorized accordingly: M9, green; M5, dark yellow; hybrid, orange; complex, pink. The S protein surface (6VSB) is colored according to antibody accessibility from black (least accessible) to red (most accessible). The RBD in the up conformation is circled in blue. Adapted with permission from ref (101). Copyright 2020 Grant et al. http://creativecommons.org/licenses/by/4.0/. (C) The same as in panel B, but for SARS-CoV, SARS-CoV-2, and MERS-CoV S proteins and with available S protein–antibody structures overlapped.
Figure 13 should be a tribute to the men and women who have invested their lives in science and, by extension, service to humanity:
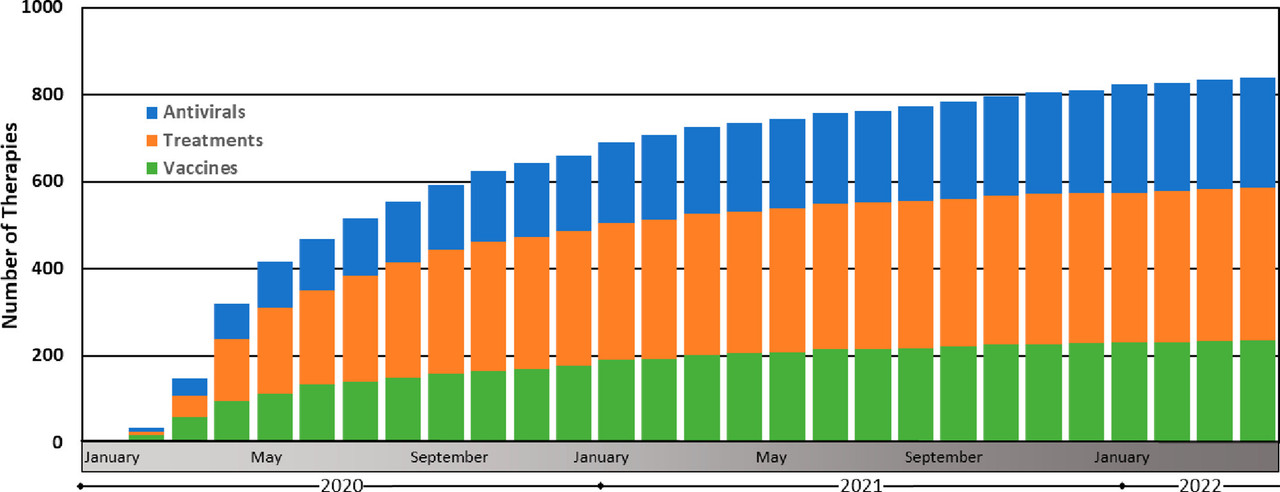
Figure 13. Therapeutic discovery during the COVID-19 pandemic. These data were compiled by the Biotechnology Innovation Organization and are presented here as the cumulative monthly number of antiviral, treatment, and vaccine therapies in development (ref (160)). Antivirals are defined here as drugs that interact directly with the virus or disrupt its ability to replicate. Treatments are defined here as drugs that treat various COVID-19-associated illnesses resulting from SARS-CoV-2 viral infection. Vaccines are defined here as prophylactic therapeutics that stimulate immunity against SARS-CoV-2.
It ain't easy folks. In fact it's pretty damned hard.
InfoView thread info, including edit history
TrashPut this thread in your Trash Can (My DU » Trash Can)
BookmarkAdd this thread to your Bookmarks (My DU » Bookmarks)
1 replies, 1216 views
ShareGet links to this post and/or share on social media
AlertAlert this post for a rule violation
PowersThere are no powers you can use on this post
EditCannot edit other people's posts
ReplyReply to this post
EditCannot edit other people's posts
Rec (6)
ReplyReply to this post
1 replies
 = new reply since forum marked as read
Highlight:
NoneDon't highlight anything
5 newestHighlight 5 most recent replies
= new reply since forum marked as read
Highlight:
NoneDon't highlight anything
5 newestHighlight 5 most recent replies
= new reply since forum marked as read
Highlight:
NoneDon't highlight anything
5 newestHighlight 5 most recent replies
Some Graphics Taking Us Down Covid-"19" Memory Lane, Evolution, Current and Future. (Original Post)
NNadir
Dec 2022
OP

Bernardo de La Paz
(50,288 posts)1. Interesting. Thank you. . . nt