Welcome to DU!
The truly grassroots left-of-center political community where regular people, not algorithms, drive the discussions and set the standards.
Join the community:
Create a free account
Support DU (and get rid of ads!):
Become a Star Member
Latest Breaking News
Editorials & Other Articles
General Discussion
The DU Lounge
All Forums
Issue Forums
Culture Forums
Alliance Forums
Region Forums
Support Forums
Help & Search
Environment & Energy
Related: About this forumSolar Topped Coal in Texas for the First Time Ever in March
Michelle Lewis, Apr 5 2024 - 11:51 am PT
Full Article: https://electrek.co/2024/04/05/solar-topped-coal-in-texas-for-the-first-time-ever-in-march/
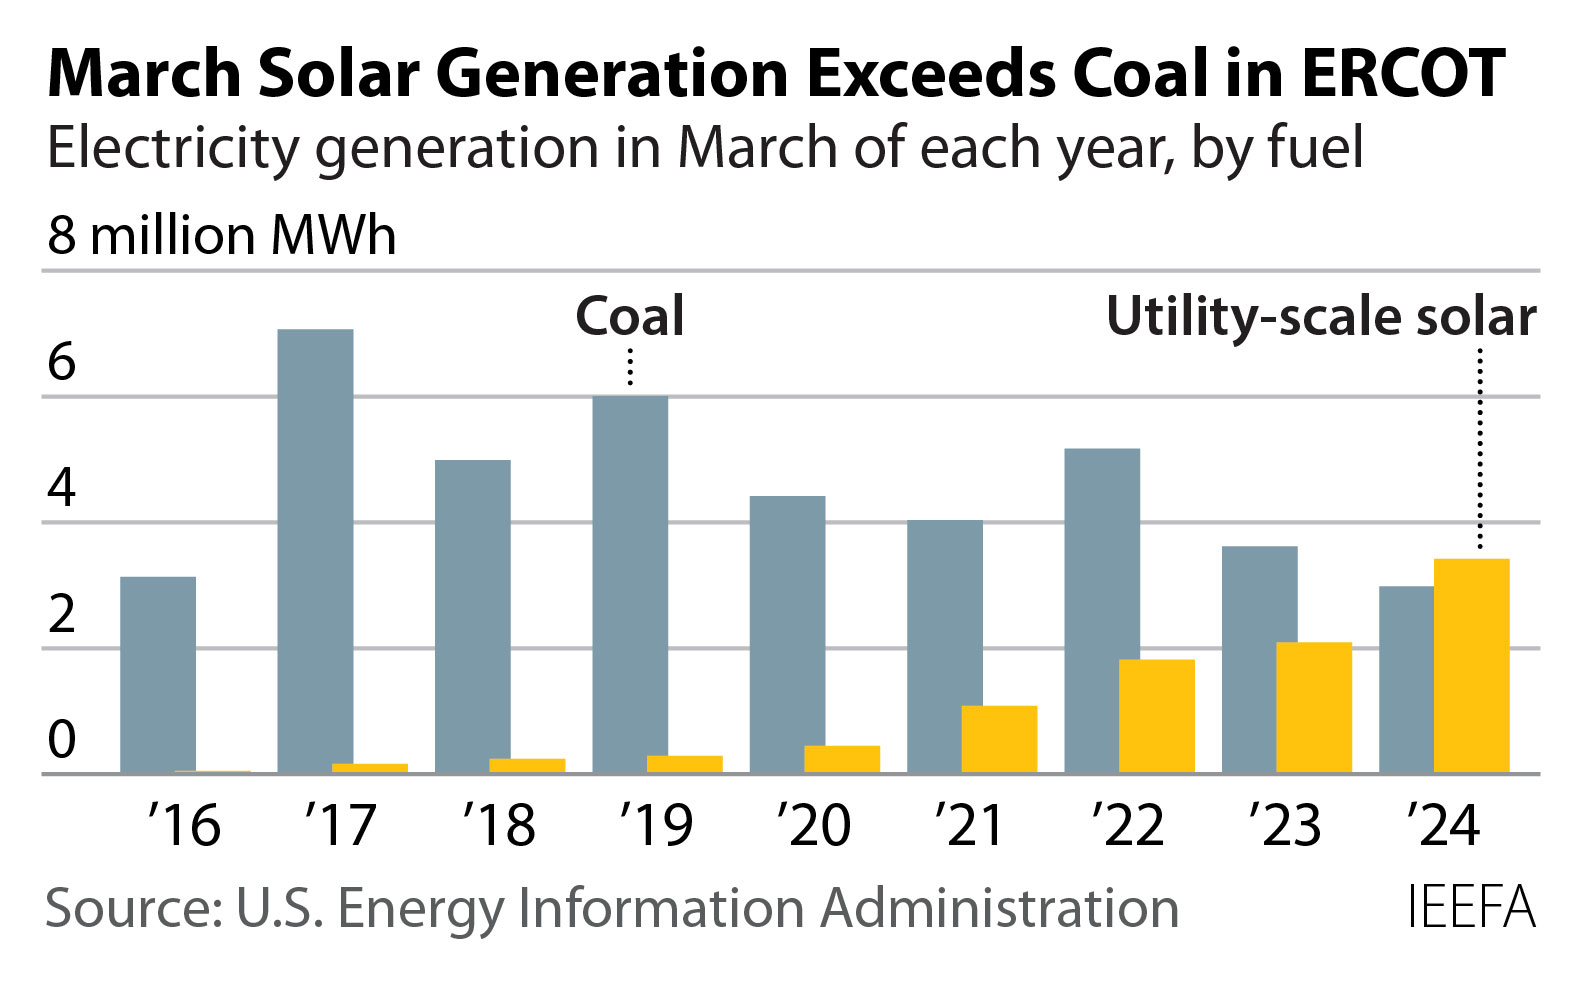
Solar topped coal’s output in Texas for the first time in any month, sending 3.26 million megawatt-hours (MWh) onto the grid vs. coal’s 2.96 million MWh in March.
-snip-

Coal’s decline in Texas is a big deal because the Lone Star State has long been the No 1 user of coal for power generation in the US. It burned twice as much as second-place Missouri in 2023 and 13% of the US total.
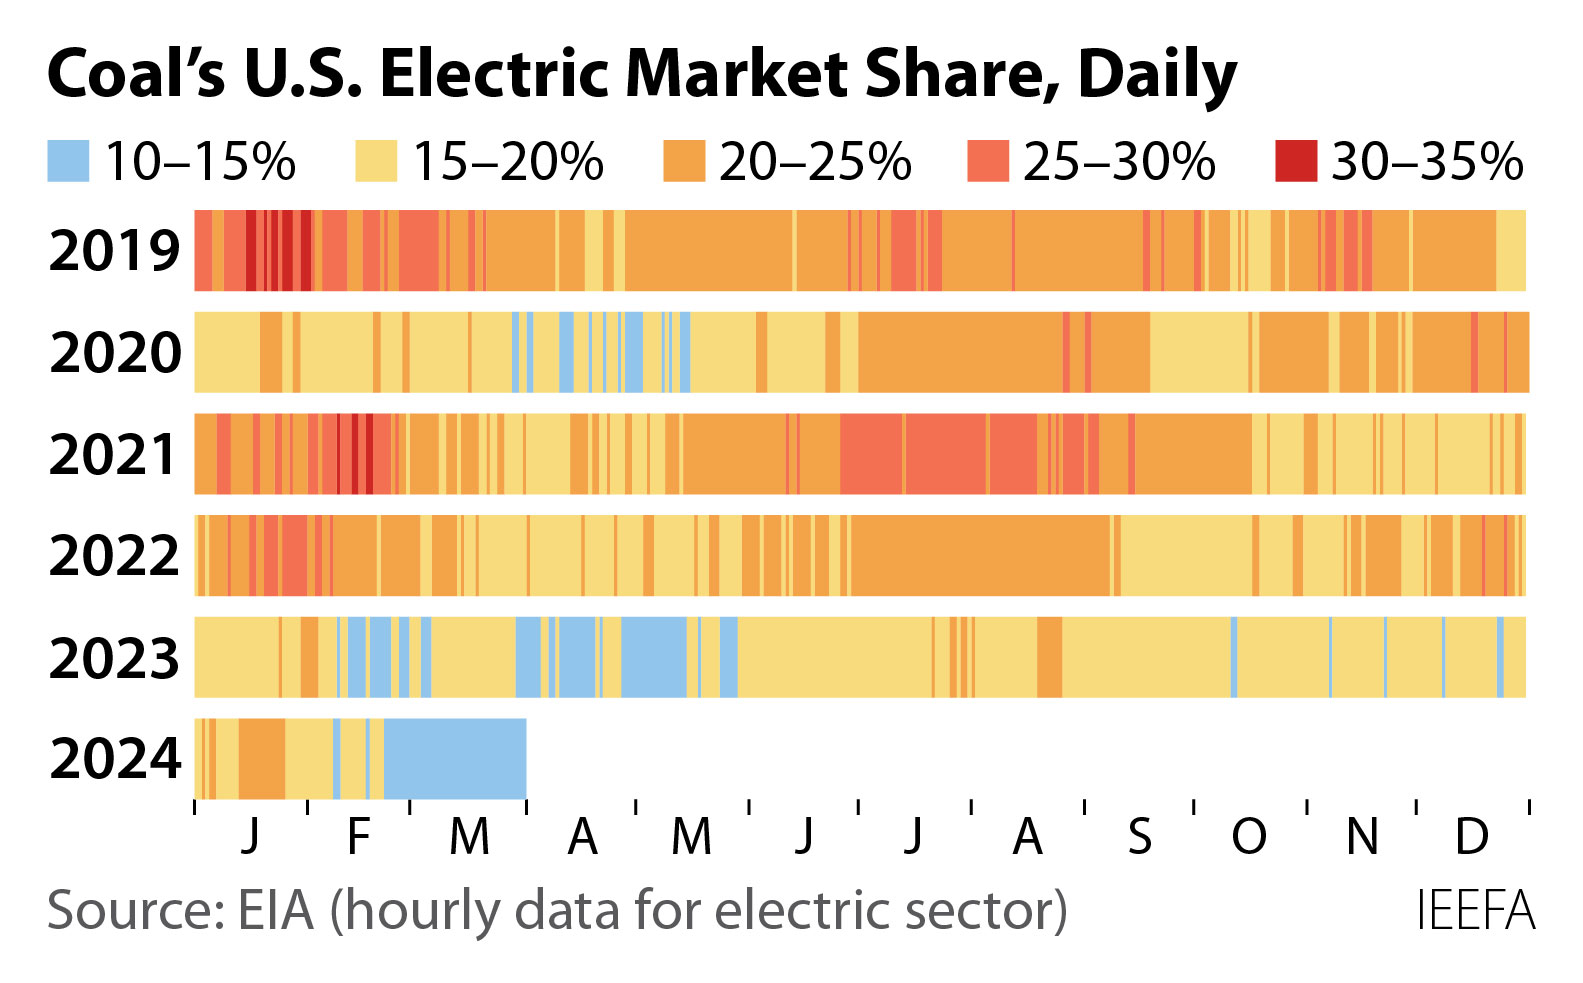
At the national level, in a first, EIA grid monitor data reflects that coal’s share of national electric generation was less than 15% every day in March. Coal’s national market share also hit a daily record low on March 29, dropping to just 11.25%.
Coal’s poor March performance is notable because, in recent years, it’s been April and May when its national market share has been at its lowest. IEEFA researchers say it’s “entirely possible that it could fall into the single digits on some days this spring.”
-snip-

Coal’s decline in Texas is a big deal because the Lone Star State has long been the No 1 user of coal for power generation in the US. It burned twice as much as second-place Missouri in 2023 and 13% of the US total.
At the national level, in a first, EIA grid monitor data reflects that coal’s share of national electric generation was less than 15% every day in March. Coal’s national market share also hit a daily record low on March 29, dropping to just 11.25%.
Coal’s poor March performance is notable because, in recent years, it’s been April and May when its national market share has been at its lowest. IEEFA researchers say it’s “entirely possible that it could fall into the single digits on some days this spring.”
InfoView thread info, including edit history
TrashPut this thread in your Trash Can (My DU » Trash Can)
BookmarkAdd this thread to your Bookmarks (My DU » Bookmarks)
3 replies, 789 views
ShareGet links to this post and/or share on social media
AlertAlert this post for a rule violation
PowersThere are no powers you can use on this post
EditCannot edit other people's posts
ReplyReply to this post
EditCannot edit other people's posts
Rec (9)
ReplyReply to this post
3 replies
 = new reply since forum marked as read
Highlight:
NoneDon't highlight anything
5 newestHighlight 5 most recent replies
Solar Topped Coal in Texas for the First Time Ever in March (Original Post)
Think. Again.
Apr 2024
OP
On the bottom of the actual report, there's this great graphic for the U.S. as a whole.
OnlinePoker
Apr 2024
#2
calimary
(84,199 posts)1. This is good to see. Encouraging.
OnlinePoker
(5,830 posts)2. On the bottom of the actual report, there's this great graphic for the U.S. as a whole.
NickB79
(19,604 posts)3. I wonder what a chart with natural gas consumption overlaid would look like?
I found this chart from the EIA that goes to 2022. Looks like natural gas use is almost entirely replacing coal, while wind and solar are covering new demand.
If I were optimistic I'd say trading coal for gas is better than nothing, but then I'd remember all the methane leaks that make natural gas as bad as coal.
https://www.eia.gov/todayinenergy/images/2021.04.21/chart2.svg
